
Kubernetes provider agnostic log collection, processing and exporting in a standardized, performant and cost-effective way.
Problem Statement
At the moment I have to solve a very specific and at the same time quite general problem. I want to be able to collect and process logs from Kubernetes clusters - which are made available by any provider in any distribution - as flexible as possible and forward them to arbitrary third-party systems.
It sounds like I want to install the jack of all trades, and I’ve been thinking about it for some time now. Today’s article is intended to be a distillation of my thoughts to perhaps help other colleagues out there in the world a little more quickly.
Kubernetes automatically retrieves logs from running containers - in slightly different ways depending on the container runtime - and saves them on the Kubernetes node running underneath. This is the central point at which conventional logging solutions retrieve logs. Both the logging agent from Microsoft Azure and Google Cloud do it this way. Self-managed versions have often relied on fluent bit and fluentd in the past. I haven’t had the pleasure of working with either of these tools myself, but I have been able to gather some impressions from colleagues in this regard and then actively decided to look for an alternative.
Two things really bothered me about existing solutions from cloud providers - firstly, the inflexibility of offerings: If I want to use the “out of the box” log transfer, I am forced to also use the very expensive and self-contained storage, analysis and view systems. The transfer out of these systems costs me a lot of money again - depending on whether it is possible at all.
The second topic is the integration with third-party systems and the way in which logs are processed before they end up in a data sink.
I depend on Google Cloud to do the right thing when transferring logs, enriching my logs (with metadata 50% of which I’m not interested in - I still have to pay for it). The situation is similar with Azure. While Google at least offers the option of writing logs in addition to a PubSub topic, with Azure I have to do three somersaults and give paws.
The whole thing at these horrendous prices is driving me crazy and I want to find a stable, cost-effective, scalable and easy-to-operate solution to this problem.
Solution
After a fairly short time, I agreed with myself that I wanted to use OpenTelemetry for the second part of the problem. Logs are an essential pillar in observability strategies and OpenTelemetry provides a clean, stable protocol that is supported by many systems and integrations and will certainly make my solution more sustainable than custom transforming. It was therefore pretty clear to me that I would want to use an OpenTelemetry Collector at least for exporting to a data sink.
So the question remained as to how I could get the logs pumped out of the Kubernetes node in the first place, and how I could then flexibly convert them into a format according to my wishes, which would be properly enriched and swallowed by an OpenTelemetry Collector.
Hold on tight, buckle up, tie your shoes: otel-collectors can also take care of these two steps.
No need for custom log collectors, fluent bit, fluentd, … but one single tool that captures logs, enriches them with the necessary information and can then flexibly transport them to any sink.
Implementation
In OpenTelemetry collectors, receivers, processors, and exporters are key components of the data pipeline. Receivers ingest telemetry data (metrics, logs, traces) from various sources like applications, agents, or external systems. Examples include otlp, prometheus, and jaeger receivers. Processors transform, filter, batch, or enhance the received data before forwarding it. Common processors include batch (for efficient export) and attributes (for modifying data attributes). Exporters send the processed data to a backend or external system such as Prometheus, Jaeger, or OpenTelemetry’s own OTLP endpoint.
Together, these components form a flexible pipeline for collecting, processing, and forwarding telemetry data.
The main things we’ll be talking about today is the filelog receiver as well as the k8sattributes processor. I won’t talk about exporters in particular, as this highly depends on your needs in terms of data sinks. We’ll stick to the debug exporter for trying everything out.
Helm Chart
How does one deploy applications to Kubernetes nowadays? Using Helm. Thankfully, the OpenTelemetry project provides a Helm Chart which is flexible and feature-rich enough so I don’t need any kind of additional Kubernetes manifests in place.
Nota bene: I decided to go with the contrib version of OpenTelemetry collector. It might not be the most lightweight and safe way, but for getting started and getting things going this is just perfect.
In the course of the article, we will introduce pieces of Helm values that we use to configure the otel-collector deployment to our needs. Since we’re relying on the contrib image for now, we will start with this config snippet:
image:
  repository: "otel/opentelemetry-collector-contrib"
At the bottom of this article, you will find the full Helm Chart values that I currently use for my implementation.
otel-collector Deployment Mode
The OpenTelemetry Collector itself is a single binary which can be used in a quite flexible amount of ways, depending on your personal use case. Let’s have a quick look at them and choose the right one.
No Agent
The first deployment pattern to use is to not use a deployment pattern at all. You simply choose to not have a collector in between you and your telemetry backend. This means that you have full control over your application, are able to instrument the OpenTelemetry SDK and send telemetry data straight to the backend. This is extraordinarily simple to use, you have absolutely no moving parts in place and you don’t have to operate an additional piece of software. But choose your poison wisely. Whenever the collection, processing or ingestion requirements are changing, you will have to change your application code and adjust it, test it, build and deploy it, … you know the drill. Also, no matter how well you architect your application, you will introduce coupling between your application code and the telemetry backend which you will send your data to. Keep this in mind. (At this time I won’t count the contra argument in that not every language has a native OpenTelemetry SDK as the most widely used ones definitely do. But if you are on the exotic path of language choice, take this into account too.)

Agent
Second pattern is the agent pattern. Your application will still generate telemetry data (best case: using the OTLP procotol, but we’ll talk about that later) and send it to a OpenTelemetry Collector. The collector then takes care of collecting the data, processing and enriching it, and sending it to a backend where it will be stored or processed even further. This is also very simple to get started because you have quite a clear 1:1 mapping between the application which is observed and the collector which is receiving the data. However this pattern makes you a bit less flexible and all of a sudden scalability is a potential problem that you will have to at least think about for a few hours. Using this pattern does not mean that your collector will have to run on the edge. It can be run as a sidecar right beneath your application (see sidecar pattern for more information) or run as a separate deployment or daemon/daemonset.

Gateway
The third and last one is the gateway pattern. This is especially useful for greater instrumentations and greater adoption. Here we think of a bunch of applications (and, potentially, other collectors!) which send telemetry data to a loadbalanced collector deployment. This centralizes and standardizes how telemetry data is leaving your application cluster.

If you have many(!) applications running and want to stay flexible with where elemetry data is sent to, keep a good level of governance over everything and shift the logic away from single applications, then the gateway approach might be your cup of tea.
For the use case of this article - remember, we’re trying to collect Kubernetes logs from nodes - I will stay with the agent pattern for now. This does not necessarily mean that I can’t move to or integrate with the gateway pattern. In the end, I am flexible enough to let my log collector point to a collector gateway instead of a telemetry data sink directly.
Using the otel-collector Helm Chart, this results in the following config snippet:
mode: "daemonset"
Kubernetes Node Logs
Before I started approaching this problem, I really had no real idea how logs are preserved inside Kubernetes. I had debugged and operated applications for quite a long time, but always relied on either the cloud provider solving the problem for me or I just used kubectl logs <...> which I thought I would know how it works.
Oh boy was I baffled when I took a look at the official Kubernetes logging architecture article. But lets start easy.
Kubernetes does the job of capturing logs from each container in the running Pods of your cluster. Literally everything that is written to stdout and stderr is captured. Since v1.31, you are even able to split stdout and stderr into different streams (which is disabled by default, but you are very welcome to test it with the PodLogsQuerySplitStreams feature gate)! This way you can fetch the log stream you want to directly via the Pod API.
A container runs inside a container runtime (nowadays usually containerd, earlier docker was used directly). The runtime takes the stdout and stderr streams of your containers and takes care of redirecting and handling them.
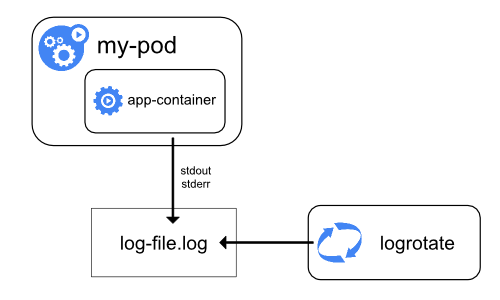
What the container runtime is not taking care of is log rotation and managing logging file structures. This is done by the kubelet. You can tune logrotation settings a bit and configure how often logs are rotated, how big logfiles are allowed to get, … but kubelet really takes care of the heavylifting. This is where I learnt that with kubectl logs <...> I am absolutely not attaching to stdout of my container application. Instead, the container is writing to stdout, which the container runtime (containerd) redirects and the kubelet is saving to logfiles. So when you run kubectl logs <...>, the kubelet is handling your request and retrieves those logs from the logfiles stored on the node your container is running on. This also means that you will not necessarily get all logs of your running container, since kubelet only returns the logs since the last logrotation.
I am talking solely about Linux systems today. I know that Kubernetes + Windows is a thing, but I don’t know a thing about it and won’t talk about it. On the Linux side of life, logs are stored at /var/log/. (Of course you can change Kubernetes behavior, but half of the worlds tools rely on this location, so why would you do that?)
By default, our precious container logs are written to /var/log/pods/.
In the course of the article, we also get some insights of how Kubernetes would like us to touch its logs: Directly from the log files.
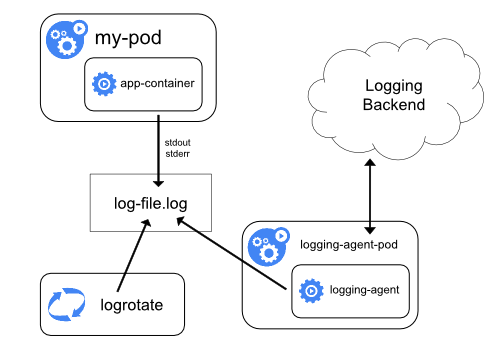
This is where the bells start ringing. Our otel-collector should definitely retrieve the Kubernetes logs directly from the node. Logging agents commonly have direct access to the directory with log files from all of the application containers of that specific node, and since we want to retrieve all logs from all over the cluster, we can use DaemonSet mechanics and deploy our otel-collector to every node.
filelog Receiver
This is the crucial part of our collector deployment. We already talked about how Kubernetes expects us to retrieve logs from the nodes, and we will use the filelog receiver for that.
This means we will have to solve two challenges: First, make the logs stored on each node available to the collector, and secondly, configure the collector to actually consume the logs written there:
config:
  receivers:
    filelog:
      include:
        - /var/log/pods/**/*.log
      exclude:
        - /var/log/pods/log-collection_*/**/*.log
      start_at: end
      include_file_path: true
      include_file_name: false
      operators:
        - type: container
          id: container-parser

extraVolumes:
  - name: varlogpods
    hostPath:
      path: /var/log/pods
  - name: varlibdockercontainers
    hostPath:
      path: /var/lib/docker/containers

extraVolumeMounts:
  - name: varlogpods
    mountPath: /var/log/pods
    readOnly: true
  - name: varlibdockercontainers
    mountPath: /var/lib/docker/containers
    readOnly: true
Poof, we’re already done configuring this! Using volumes with hostPath and volumeMounts in read-only mode, we make the logs available to the collector container, and with the filelog receiver we configure reading those logs. Since we will use the debug exporter which is itself going to write the collected logs to stdout (which then is written to the logfile and would be read by the collector, printed to stdout again, … you get it) we ignore logs coming from our collector (which I named log-collector).
Kubernetes RBAC Permissions
Since we do not only want to retrieve logs and forward them but instead enrich them with additional information from the Kubernetes cluster, our otel-collector will need some permissions to actually get this information.
We will want to collect information about Namespaces, Pods an ReplicaSets for now, which can be done using the following Helm values:
serviceAccount:
  create: true
  name: collector

clusterRole:
  create: true
  name: log-collector
  rules:
    - apiGroups:
        - ""
      resources:
        - "pods"
        - "namespaces"
      verbs:
        - "get"
        - "watch"
        - "list"
    - apiGroups:
        - "apps"
      resources:
        - "replicasets"
      verbs:
        - "get"
        - "list"
        - "watch"
    - apiGroups:
        - "extensions"
      resources:
        - "replicasets"
      verbs:
        - "get"
        - "list"
        - "watch"
  clusterRoleBinding:
    name: log-collector
This is going to allow the collector to retrieve the needed information from the Kubernetes API server.
k8sattributes Processor
Now that we have the necessary permissions in place for our collector to retrieve data for enriching our logs, we should also use it. The stage belongs to k8sattributes now which is able to query the Kubernetes API and associate the retrieved data with the retrieved logs. You will definitely want to read the documentation for this processor to configure it to your needs.
My configuration for the moment is relatively small and looks like this:
config:
  processors:
    k8sattributes:
      auth_type: "serviceAccount"
      extract:
        metadata: # extracted from the pod
          - k8s.namespace.name
          - k8s.pod.name
          - k8s.pod.start_time
          - k8s.pod.uid
          - k8s.deployment.name
          - k8s.node.name
        labels:
          - tag_name: app
            key: app
            from: pod
          - tag_name: name
            key: app.kubernetes.io/name
            from: pod
          - tag_name: workload_identity
            key: azure.workload.identity/use
            from: pod
      pod_association: # How to associate the data to a pod (order matters)
        - sources: # First try to use the value of the resource attribute k8s.pod.ip
            - from: resource_attribute
              name: k8s.pod.ip
        - sources: # Then try to use the value of the resource attribute k8s.pod.uid
            - from: resource_attribute
              name: k8s.pod.uid
        - sources: # If neither of those work, use the request's connection to get the pod IP.
            - from: connection
I am experimenting with Azure Workload Identity a bit and therefore want to see which of my Pod logs are emmitted by applications which already use workload identity. The rest is pretty standard and enriches logs with basic Kubernetes information that is needed for debugging.
Testing
For some quick testing, we can deploy the log collector and a test application (raw nginx) and make some HTTP calls for testing to see if our logs are collected correctly.
First, install the Helm Chart:
helm repo add open-telemetry https://open-telemetry.github.io/opentelemetry-helm-charts
helm upgrade --install --namespace log-collection otel-collector k8s/opentelemetry-collector --values values.yaml --create-namespace
If you do not have a log emitting application ready in your cluster, use a bare nginx and make some HTTP calls to it:
helm repo add bitnami https://charts.bitnami.com/bitnami
helm install test-nginx bitnami/nginx --namespace test --create-namespace
kubectl port-forward -n test svc/test-nginx 8888:80

# In a separate terminal: make calls to the test application
watch -n5 'curl -v http://localhost:8888'
Now we can have a look how the logs look like in comparison to the original ones retrieved from our logfile:
# Watch the original logs
kubectl logs -n test -f deployments/test-nginx

# In a separate terminal, watch the collector logs
kubectl logs -n log-collection -f daemonsets/otel-collector
After a short amount of time, you will see the enriched logs popping up in the otel-collector DaemonSet.
Conclusion
After discarding my initial idea of sticking to known stacks like fluent-bit, fluentd or trying to squeeze out features from cloud provider logging solutions, I had a deeper look at OpenTelemetry and its capabilities.
I was really overwhelmed by the amount of receivers, processors and exporters available, and I think OpenTelemetry is - despite its rising popularity - really still underrated. If the industry continues to put its focus on the OpenTelemetry project and it gains even more traction, this is going to remove the need for so many other brittle solutions.
My personal future default for retrieving, enriching and forwarding any kind of telemetry data is definitely going to be OpenTelemetry and I will start out with nothing more but a collector / SDK implementation on my whiteboard instead of adding other existing stuff to it.
Full Configuration
Since I want to save you from copy-pasting all the YAML snippets together, you can find the full Helm Chart values down here:
mode: "daemonset"
config:
  exporters:
    debug:
      verbosity: normal
  extensions:
    # The health_check extension is mandatory for this chart.
    # Without the health_check extension the collector will fail the readiness and liveliness probes.
    # The health_check extension can be modified, but should never be removed.
    health_check:
      endpoint: ${env:MY_POD_IP}:13133
  processors:
    k8sattributes:
      auth_type: "serviceAccount"
      extract:
        metadata: # extracted from the pod
          - k8s.namespace.name
          - k8s.pod.name
          - k8s.pod.start_time
          - k8s.pod.uid
          - k8s.deployment.name
          - k8s.node.name
        labels:
          - tag_name: app
            key: app
            from: pod
          - tag_name: name
            key: app.kubernetes.io/name
            from: pod
          - tag_name: workload_identity
            key: azure.workload.identity/use
            from: pod
      pod_association: # How to associate the data to a pod (order matters)
        - sources: # First try to use the value of the resource attribute k8s.pod.ip
            - from: resource_attribute
              name: k8s.pod.ip
        - sources: # Then try to use the value of the resource attribute k8s.pod.uid
            - from: resource_attribute
              name: k8s.pod.uid
        - sources: # If neither of those work, use the request's connection to get the pod IP.
            - from: connection
  receivers:
    filelog:
      include:
        - /var/log/pods/**/*.log
      exclude:
        - /var/log/pods/log-collection_*/**/*.log
      start_at: end
      include_file_path: true
      include_file_name: false
      operators:
        - type: container
          id: container-parser
  service:
    extensions:
      - health_check
    pipelines:
      logs:
        receivers: [filelog]
        processors: [k8sattributes]
        exporters: [debug]
image:
  repository: "otel/opentelemetry-collector-contrib"

serviceAccount:
  create: true
  name: collector

clusterRole:
  create: true
  name: log-collector
  rules:
    - apiGroups:
        - ""
      resources:
        - "pods"
        - "namespaces"
      verbs:
        - "get"
        - "watch"
        - "list"
    - apiGroups:
        - "apps"
      resources:
        - "replicasets"
      verbs:
        - "get"
        - "list"
        - "watch"
    - apiGroups:
        - "extensions"
      resources:
        - "replicasets"
      verbs:
        - "get"
        - "list"
        - "watch"
  clusterRoleBinding:
    name: log-collector

extraVolumes:
  - name: varlogpods
    hostPath:
      path: /var/log/pods
  - name: varlibdockercontainers
    hostPath:
      path: /var/lib/docker/containers

extraVolumeMounts:
  - name: varlogpods
    mountPath: /var/log/pods
    readOnly: true
  - name: varlibdockercontainers
    mountPath: /var/lib/docker/containers
    readOnly: true